想问怎么配置 KPA?看 Serving 文档 Configuring autoscaling 去
大概弹性的流程还是贴贴官网图片就好
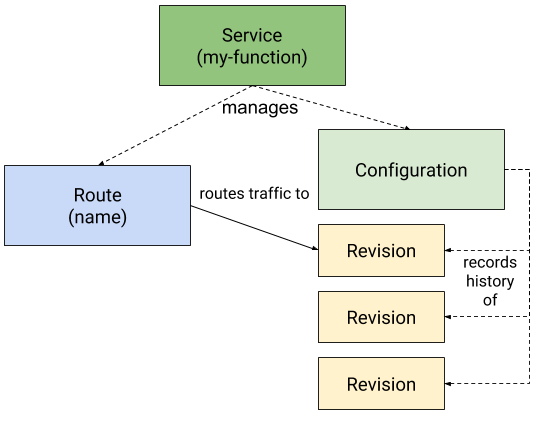
以上就是 Serving 中四个重要 CRD 的关系,实际使用过程中我们只定义 Service 这个 Object。
其中 Serving 组件提供了弹性能力,而其 workflow 大体如下
   +---------------------+
   | ROUTE               |
   |                     |
   |   +-------------+   |
   |   | Istio Route |---------------+
   |   +-------------+   |           |
   |         |           |           |
   +---------|-----------+           |
             |                       |
             |                       |
             | inactive              | active
             |  route                | route
             |                       |
             |                       |
             |                +------|---------------------------------+
             V         watch  |      V                                 |
       +-----------+   first  |   +- ----+  create   +------------+    |
       | Activator |------------->| Pods |<----------| Deployment |<--------------+
       +-----------+          |   +------+           +------------+    |          |
             |                |       |                                |          | resize
             |   activate     |       |                                |          |
             +--------------->|       |                                |          |
                              |       |               metrics          |   +------------+
                              |       +----------------------------------->| Autoscaler |
                              |                                        |   +------------+
                              |                                        |
                              | REVISION                               |
                              +----------------------------------------+
(以上摘自 Autoscaling)
Serving 提供了基于 KPA 和 HPA 两种弹性方式,但以下只讨论 KPA 方式。
本文基于 Serving@v0.11.0 展开。
上点代码
咱们先不扯别的直接先撸计算 DesiredReplicas 的代码。
在 serving/pkg/autoscaler/autoscaler.go 里有这么一个函数
// Scale calculates the desired scale based on current statistics given the current time.
// desiredPodCount is the calculated pod count the autoscaler would like to set.
// validScale signifies whether the desiredPodCount should be applied or not.
func (a *Autoscaler) Scale(ctx context.Context, now time.Time) (desiredPodCount int32, excessBC int32, validScale bool) {
...
}
看大意就是说计算下当下(now)时间点期望的 Pod 数以及 额外突发量(EBC、excessBC)。
期望 Pod 能理解,但 EBC 是个什么玩意。。咱们先继续往下看
func (a *Autoscaler) Scale(ctx context.Context, now time.Time) (desiredPodCount int32, excessBC int32, validScale bool) {
	// 获取当前 DeciderSpec 和 实例数
	spec, podCounter := a.currentSpecAndPC()
	originalReadyPodsCount, err := podCounter.ReadyCount()
	// If the error is NotFound, then presume 0.
	if err != nil && !apierrors.IsNotFound(err) {
		return 0, 0, false
	}
	// 最小 ready 设为 1
	readyPodsCount := math.Max(1, float64(originalReadyPodsCount))

	metricKey := types.NamespacedName{Namespace: a.namespace, Name: a.revision}

	metricName := spec.ScalingMetric
	var observedStableValue, observedPanicValue float64
	// 决策 Scaling 类型,获取 Stable 和 Panic 两种模式下的指标平均值
	switch spec.ScalingMetric {
	case autoscaling.RPS:
...
	default:
...
	}

	maxScaleUp := math.Ceil(spec.MaxScaleUpRate * readyPodsCount)
	maxScaleDown := math.Floor(readyPodsCount / spec.MaxScaleDownRate)

	// 根据阈值计算下 Stable 和 Panic 分别期望的实例数
	dspc := math.Ceil(observedStableValue / spec.TargetValue)
	dppc := math.Ceil(observedPanicValue / spec.TargetValue)

	// 修整下实例数边界
	desiredStablePodCount := int32(math.Min(math.Max(dspc, maxScaleDown), maxScaleUp))
	desiredPanicPodCount := int32(math.Min(math.Max(dppc, maxScaleDown), maxScaleUp))

	// 判定 Panic 值是否已经超过了 Panic 阈值(是否应该进入 Panic 模式)
	isOverPanicThreshold := observedPanicValue/readyPodsCount >= spec.PanicThreshold

	a.stateMux.Lock()
	defer a.stateMux.Unlock()
	if a.panicTime.IsZero() && isOverPanicThreshold {
		// 进入 Panic 模式
		logger.Info("PANICKING")
		a.panicTime = now
		a.reporter.ReportPanic(1)
	} else if !a.panicTime.IsZero() && !isOverPanicThreshold && a.panicTime.Add(spec.StableWindow).Before(now) {
		// 需要解除 Panic,已经超过 stable 窗口时间了
		logger.Info("Un-panicking.")
		a.panicTime = time.Time{}
		a.maxPanicPods = 0
		a.reporter.ReportPanic(0)
	}

	// 设置最终期望的 Pod 数
	if !a.panicTime.IsZero() {
		logger.Debug("Operating in panic mode.")
		// panic 模式下只扩不缩
		if desiredPanicPodCount > a.maxPanicPods {
			logger.Infof("Increasing pods from %d to %d.", originalReadyPodsCount, desiredPanicPodCount)
			a.panicTime = now
			a.maxPanicPods = desiredPanicPodCount
		} else if desiredPanicPodCount < a.maxPanicPods {
			logger.Debugf("Skipping decrease from %d to %d.", a.maxPanicPods, desiredPanicPodCount)
		}
		desiredPodCount = a.maxPanicPods
	} else {
		// Stable 模式,取 stable 计算后的 pod 数
		logger.Debug("Operating in stable mode.")
		desiredPodCount = desiredStablePodCount
	}

	// Compute the excess burst capacity based on stable value for now, since we don't want to
	// be making knee-jerk decisions about Activator in the request path. Negative EBC means
	// that the deployment does not have enough capacity to serve the desired burst off hand.
	// EBC = TotCapacity - Cur#ReqInFlight - TargetBurstCapacity

	// EBC = 当前所有 Ready Pod 的总设定容量 - 当前稳定量 - 突发容忍量
	// 所以这玩意也就是:超了多少,后面用于熔断场景。
	excessBC = int32(-1)
	switch {
	case a.deciderSpec.TargetBurstCapacity == 0:
		excessBC = 0
	case a.deciderSpec.TargetBurstCapacity >= 0:
		excessBC = int32(math.Floor(float64(originalReadyPodsCount)*a.deciderSpec.TotalValue - observedStableValue -
			a.deciderSpec.TargetBurstCapacity))
		logger.Infof("PodCount=%v Total1PodCapacity=%v ObservedStableValue=%v TargetBC=%v ExcessBC=%v",
			originalReadyPodsCount,
			a.deciderSpec.TotalValue,
			observedStableValue, a.deciderSpec.TargetBurstCapacity, excessBC)
	}

	a.reporter.ReportExcessBurstCapacity(float64(excessBC))
	a.reporter.ReportDesiredPodCount(int64(desiredPodCount))

	return desiredPodCount, excessBC, true
}
过完这把,也差不多知道这个是怎么算,算的是啥的。不过还需要详细看下 stableValue 和 panicValue 的计算方式。RPS 和 Concurrency 模式的两个计算都是差不多的,所以我们只看并发模式下的计算就好。
计算核心在 serving/pkg/autoscaler/collector.go:L332
// stableAndPanicStats calculates both stable and panic concurrency based on the
// given stats buckets.
func (c *collection) stableAndPanicStats(now time.Time, buckets *aggregation.TimedFloat64Buckets) (float64, float64, error) {
	spec := c.currentMetric().Spec
	var (
		panicAverage  aggregation.Average
		stableAverage aggregation.Average
	)
	if !buckets.ForEachBucket(
		aggregation.YoungerThan(now.Add(-spec.PanicWindow), panicAverage.Accumulate),
		aggregation.YoungerThan(now.Add(-spec.StableWindow), stableAverage.Accumulate),
	) {
		return 0, 0, ErrNoData
	}

	return stableAverage.Value(), panicAverage.Value(), nil
}

func YoungerThan(oldest time.Time, acc Accumulator) Accumulator {
	return func(time time.Time, bucket float64Bucket) {
		if !time.Before(oldest) {
			acc(time, bucket)
		}
	}
}

// Average is used to keep the values necessary to compute an average.
type Average struct {
	sum   float64
	count float64
}

// Accumulate accumulates the values needed to compute an average.
func (a *Average) Accumulate(_ time.Time, bucket float64Bucket) {
	a.sum += bucket.sum()
	a.count++
}

// Value returns the average or 0 if no buckets have been accumulated.
func (a *Average) Value() float64 {
	if a.count == 0 {
		return 0
	}
	return a.sum / a.count
}
看完这波代码懂了,算不同时间窗口(Stable 和 Panic) 里的 metric 的均值,函数名都写得那么高级害我以为又是什么高端代码。
然后往上查,看从那边调用(此处省略无数代码),确定是在 serving/pkg/reconciler/autoscaling/kpa/controller.go:L44@NewController 调用了,而 cmd 中调用了 NewController。
结论
通过 Stable 和 Panic 两种时间窗口来优化弹性的效率,感觉还是挺赞的